Sampling at scale with OpenTelemetry
The official documentation from OpenTelemetry on Sampling is quite good: Sampling | OpenTelemetry . It talks about head and tail sampling and the common difficulties with tail sampling at scale. But I’ve been thinking about sampling a lot recently and here are some of my thoughts.
For a little bit of context: At Grafana Labs, we run services with a massive throughput, our 3 largest services handle ~200K write requests per second, and ~30K read requests per second. We also produce highly granular internal traces, sometimes having 1000s of spans. We head-sample massively and even after that our tracing system (running Tempo) ingests 2 Million spans/sec from just our internal services. I’ve helped set up the initial system based on Jaeger and remote sampling more than 5 years ago and the sampling setup is still mostly unchanged internally.
Sampling Strategies
Head Sampling is an easy win
When adopting tracing this is the easiest sampling method to adopt. You can simply set it using environment variables. In OpenTelemetry, these are:
OTEL_TRACES_SAMPLER="parentbased_traceidratio"
OTEL_TRACES_SAMPLER_ARG="0.5" # for 50% sampling ratio
We started off by setting a low sampling rate and that more or less worked for a couple of weeks. But this is not a very useful sampling strategy. Different endpoints have different characteristics, and need to be sampled differently. For example, you might have 10x-100x as many writes as reads, and you might want a super low sampling rate for the write path and much higher sampling rate for the read path.
This is not possible with simple head sampling. Which brings me to my next point.
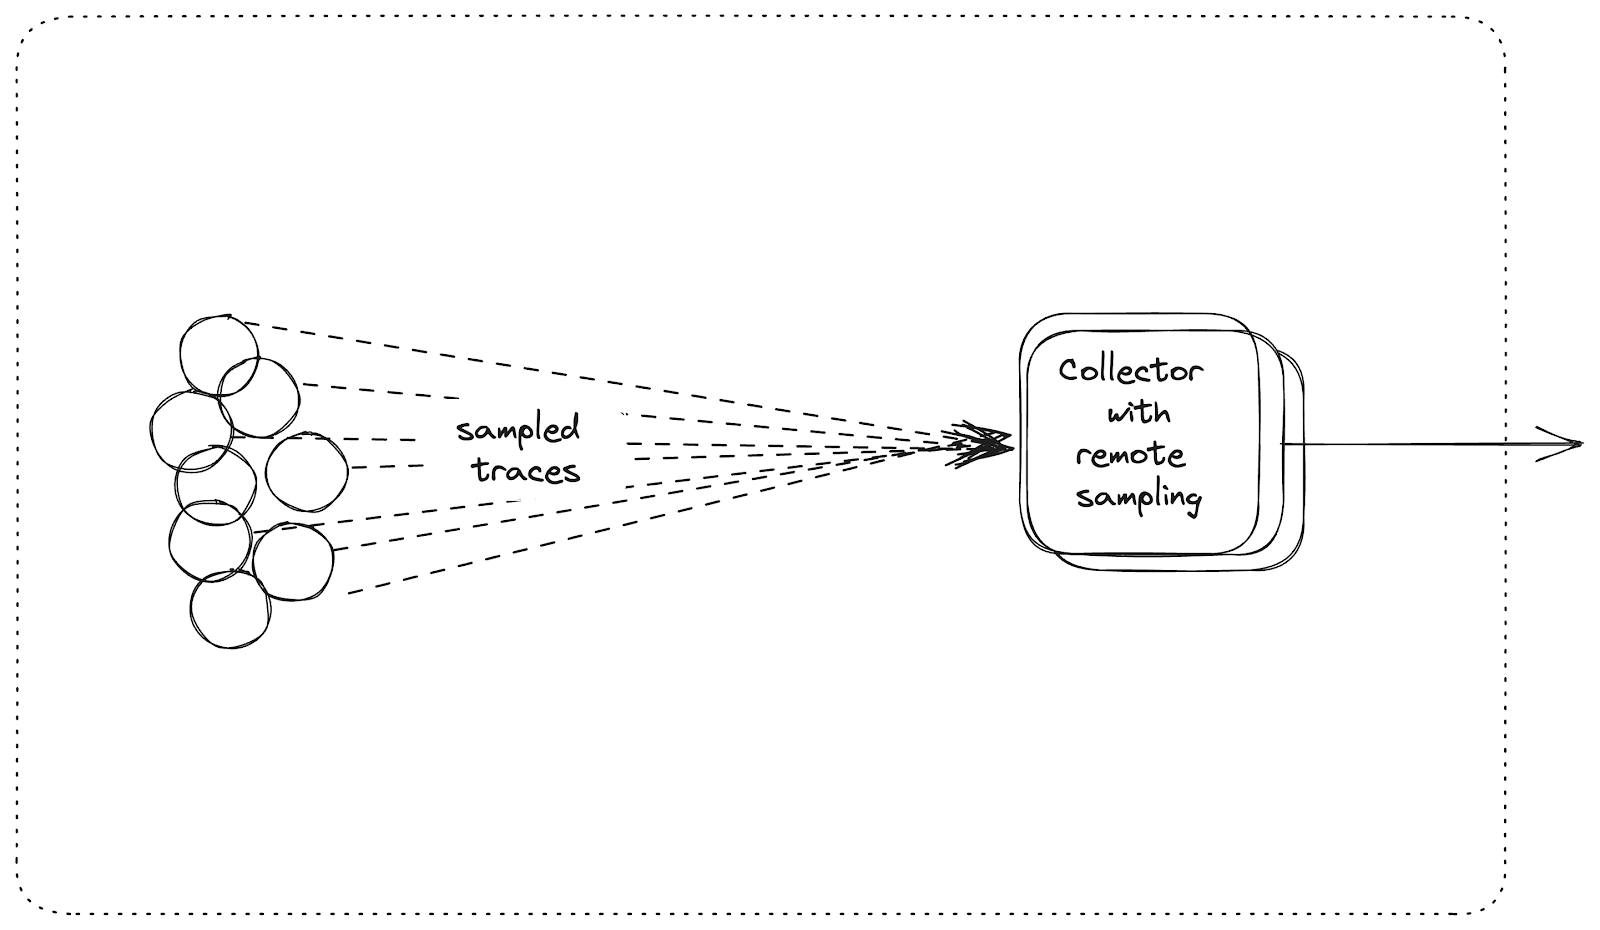
Remote Sampling is extremely underrated
Jaeger introduced remote sampling. This is head sampling, but supercharged. In a config file, you can specify the default sampling rate and strategy for all operations, and then specifically override it for a few operations.
{
  "service_strategies": [
    {
      "service": "foo",
      "type": "probabilistic",
      "param": 0.8,
      "operation_strategies": [
        {
          "operation": "op1",
          "type": "probabilistic",
          "param": 0.2
        },
        {
          "operation": "op2",
          "type": "probabilistic",
          "param": 0.4
        }
      ]
    },
    {
      "service": "bar",
      "type": "ratelimiting",
      "param": 5
    }
  ],
}
Is an example of the config file, and this shows that for service foo, the default sampling rate is 80%, but for operation op1 it is 20%, and for op2 it is 40%.
But the best part about remote sampling is that the sampling strategies are refreshed every minute. So you could set a low sampling rate, but during an incident, increase it to debug certain code-paths.
This is what we use extensively and our strategies.json file is 4000 lines long. And we can increase or decrease the sampling rate during incidents by changing this file, and within a minute the applications pick up the new sampling rates. I’ve set this up in August 2018 for a single service and it has just scaled as the company scaled.OpenTelemetry SDKs also have the support for remote sampling, and you can configure the Collector to serve the strategies file. What blows my mind is how little documentation there is and how no blog-posts talk about this.
Tail sampling is powerful. But it's not easy.
The best sampling policy in terms of features and control is the tail sampling strategy. Tail sampling collects all the spans of a trace to be together, before deciding to sample that trace.
You can specify the same rules as remote sampling, but because you have all the spans together, you could then make sampling decisions based on the spans (rather than just the root span). A common use case is sampling X% of the traces, but 100% of the traces that have an error-ing span in them.
But this requires all the spans of a trace to be together. Which requires two deployments of the Collector, the first layer routing all the spans of a trace to the same collector in the downstream deployment (using load-balancing exporter). And the second layer doing the tail sampling.

Another complication is that you never know if a trace is “done”. So the tail-sampling processor will just collect spans in memory for 30s (default, can be changed), and after 30s, it considers a trace to be finished and makes the sampling decision. This means you need to be able hold all the spans generated for 30s in memory, and this is quite resource intensive, requiring the tail-sampling cluster needs to be scaled to 100-1000s of GBs of RAM.
This is expensive, and the architecture is hard to operate and scale. But if you can get it right, it could pay off heavily. Because you will be capturing all the interesting traces, you could end up storing a lot less data, and any cost of the sampling infrastructure could be offset by the cost of storage savings.
Improvements to tail sampling processor
Currently, it stores all the traces for a specified interval (default 30s), and there is no way to override it. For example, our writes take around 100ms-3s, and our reads take up to 50s. And there are 10x as many writes as reads. It is wasteful to store everything for the 50s. We should be able to define a decision wait per service and operation. This way we can keep the write path traces for 5s, and read path traces for 60s without breaking the bank.
Metric Generation
A lot of people generate RED and other service metrics from the traces emitted by a service. How and where to generate metrics is heavily dependent on the sampling strategy used. But before we get into that, it’s good to understand why.
Why generate metrics from traces?
This was the first question that came to my head. I am a Prometheus maintainer and I am used to metrics being generated by the applications themselves. It can’t get more accurate than that, as you lose information if you generate metrics on top of sampled data.
But traces, span multiple operations across services and thereby contain a lot more context compared to metrics emitted by a single application. This lets us include additional data into the metrics generated, such as the upstream and downstream applications. For example the Tempo service graph is powered by metrics generated from traces and it's really hard to achieve the same with just metrics.
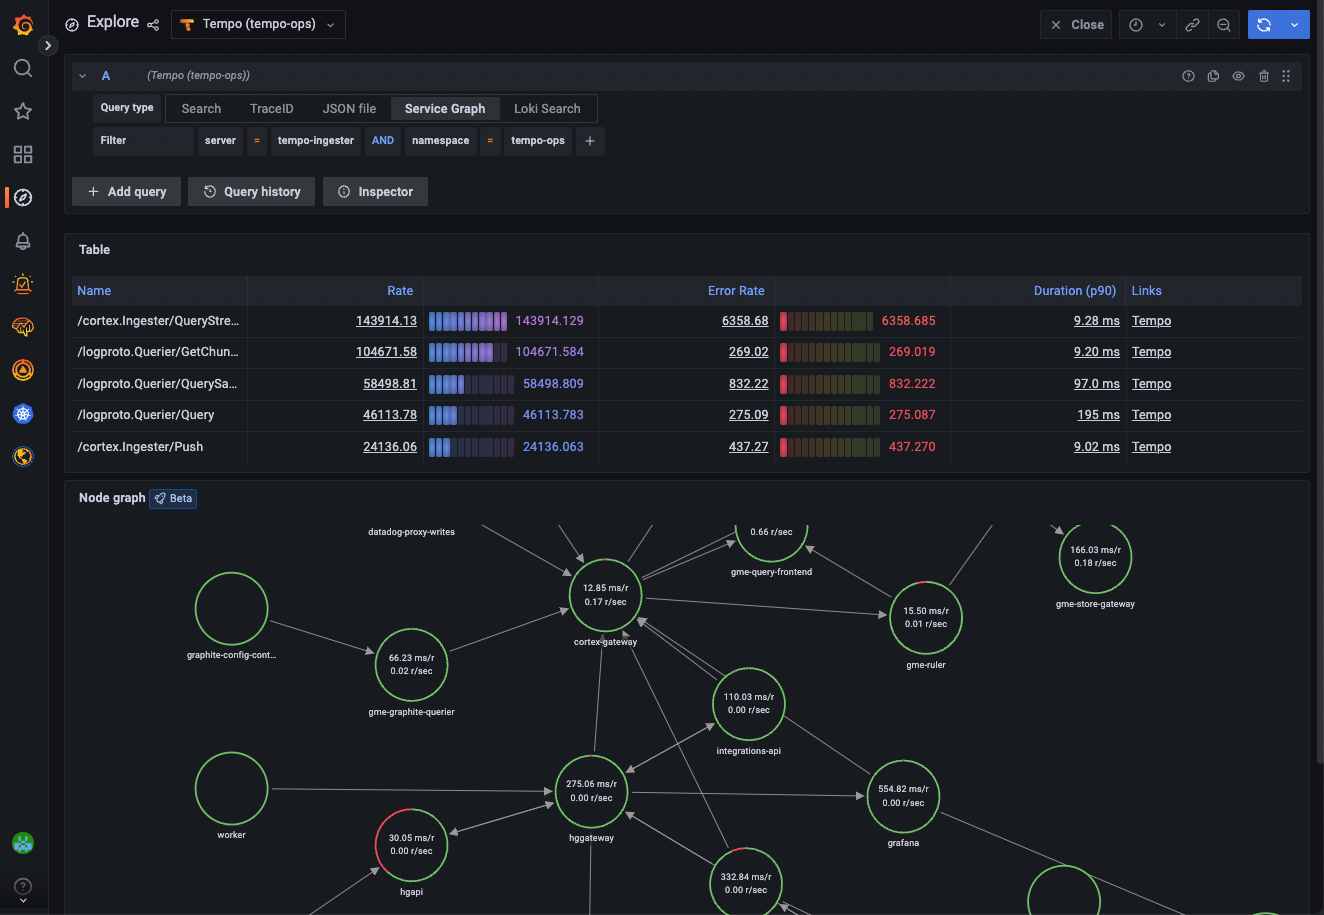
You can achieve the same with the service graph connector in the OpenTelemetry Collector.
Further, it is common to RED metrics on endpoints, but not very common to do RED metrics on function calls, which is something generating metrics from spans enabled. You can achieve it with purely metrics, but it's less common to wrap a function call in metric, than wrapping it in a span.
NB: Autometrics is making it easier to see function performance with just metrics.
Metric generation with head sampling
Now if you want to generate metrics on sampled traces, they are bound to be inaccurate. For example, if you have a sampling rate of 10%, and you generate metrics on the traces, the requests/sec would be 10% of the actual value.
A solution to this is to blow up the number based on the sampling rate. For example, if you know the sampling rate is 5% and you see 5 reqs/sec in traces, you can blow it up to 100 (5 * 20) reqs/sec. But this is not very accurate and it's actually worse for errors. If you see a single error, it gets blown up into 20 errors. The duration metrics are also not super accurate. This is bad for low traffic services, but with enough throughput and scale, you might get semi-decent accuracy.
One caveat is that this works only with probabilistic sampling, and doesn’t work with rate-limited samplers.
OpenTelemetry propagates the sampling information as part of trace-state, but the existing span metrics and service graph processors don’t yet have a mechanism to adjust metrics based on the sampling info.
Metric generation with tail sampling
There is no way to generate accurate metrics based on the sampled data with tail-sampling. For example, if you have a policy to only sample error=true and user.id=1234, you cannot get the overall req/sec for the service.
The metrics need to be generated before the sampling happens. And the best place to do it is the first layer of routing collectors.

Member discussion