SLOs are not just about error budgets
I started my career at Grafana Labs, building and running our hosted Prometheus solution on top of Cortex (now Mimir). I was on-call for the system roughly one week out of the month, and have seen it grow from one customer to hundreds. And SLOs were one of the best things we adopted to help improve our operational overhead. Adopting them improved my on-call quality of life instantaneously.
When I speak to others about adopting SLOs, I expect them to be excited, but the general reaction is skepticism about their usefulness. I recently realized that this is because what I find useful about SLOs is very different from what people expect SLOs to provide.
Life before SLOs
Before we adopted SLOs at Grafana Labs, we had simple alerts:
# If more than 1% of requests are failing for 15mins, trigger an alert
- alert: 'CortexGWRequestErrors',
  expr: |-
        sum by (namespace, job, route) (
          rate(cortex_gw_request_duration_seconds_count{status_code=~"5.."}[1m])
        )
      /
        sum by (namespace, job, route) (rate(cortex_gw_request_duration_seconds_count[1m]))
      > 0.01
  for: 15m
  labels:
    severity: critical
  annotations:
    message: |-
           {{ $labels.job }} {{ $labels.route }} is experiencing {{ printf "%.2f" $value }}% errors.

# If p99 is greater than 1s for 15mins, trigger an alert
- alert: 'CortexGWRequestLatency',
  expr: |-
       namespace_job_route:cortex_gw_request_duration_seconds:99quantile{route!="metrics"} > 1
  for: 15m
  labels:
    severity: critical
  annotations:
    message: |-
            {{ $labels.job }} {{ $labels.route }} is experiencing {{ printf "%.2f" $value }}s 99th percentile latency.
We had a for period of 15mins to make sure momentary spikes don’t page us, and only serious issues do.
These are simple alerts, but they worked for us for a long time. Until they did not. There are a couple of issues with these.
Delayed notifications
If the entire cluster was down, it would take 15mins to trigger an alert. And if it paged during non-work hours (weekend, etc.) the on-call person was likely 15mins away from their laptop. This added a 30mins response time to a full cluster outage. As we scaled, this delay simply didn’t cut it.
Noisy, in actionable alerts
Our goal was to have a query experience where 99.5% of the queries were quicker than 2.5s.
During low traffic days (weekends, etc.), we had cases where one user opening a heavy and complex dashboard caused the latencies to spike temporarily and trigger the CortexGWLatencyAlert above. And this alert fired A LOT. Sometimes many times a day. However, when we looked back at the end of the month, we noticed that the 99.5%ile was super low (around 200ms) and well within target.
There were enough quick requests that momentary slow queries didn’t actually affect our targets. But we couldn’t look at the big picture (only 15mins in our alert) so we got alerted for every small issue. Finally, typically these alerts weren’t actionable because by the time we scrambled to a laptop and got to debugging, the alert resolved itself.
Enter SLOs
We turned to SLOs to address the issues outlined above. Björn had recently joined us from SoundCloud where he helped roll out SLOs, and he set out to implement them for Mimir and Loki. He had to make a few modifications to make the SLOs work with latency, but it was relatively straightforward (I mean, Björn did all the work, so straightforward for me).
It was night and day when Björn put this in place for our metrics service. We went from paging every few days, sometimes multiple times a day, to only paging every few weeks for this particular alert. And when it did page, there was an actual issue that we could solve.
Every other team [at Grafana Labs] quickly was like, “Oh, we want that,” and they copy-pasted the alert rules that Björn built and implemented them for their service. And we saw a huge reduction in our on-call load.
Errors budgets weren't the big deal
To me, this was the whole reason to adopt SLO based alerting. To reduce on-call load and have mostly actionable alerts. This is why I love SLOs.
Adopting SLOs also gave me the ability to look at Mimir’s “error budget” for the month. And the number of times I asked “I wonder how much budget we have remaining this month?” is exactly 0. I didn’t even know what to do with that number. Did we slow down deployments if there was only 10% of the error budget remaining? NO.
We did slow down feature releases at times, but not because we burnt our budget. We did it because the on-call team is overloaded with issues. We did it because our service became too unstable with frequent incidents. It could be correlated with error budgets, but not really.
For example, if a service had an issue on the first day of the month and burnt 95% of the budget in that incident, would we slow down / stop feature releases for that month? Nope. But If we had 3 outages in a week, for sure. I think it's more practical to go with the gut feeling of the manager and tech-lead in this case and use the error budget as an input than just blindly relying on it.
SLOs products got it wrong
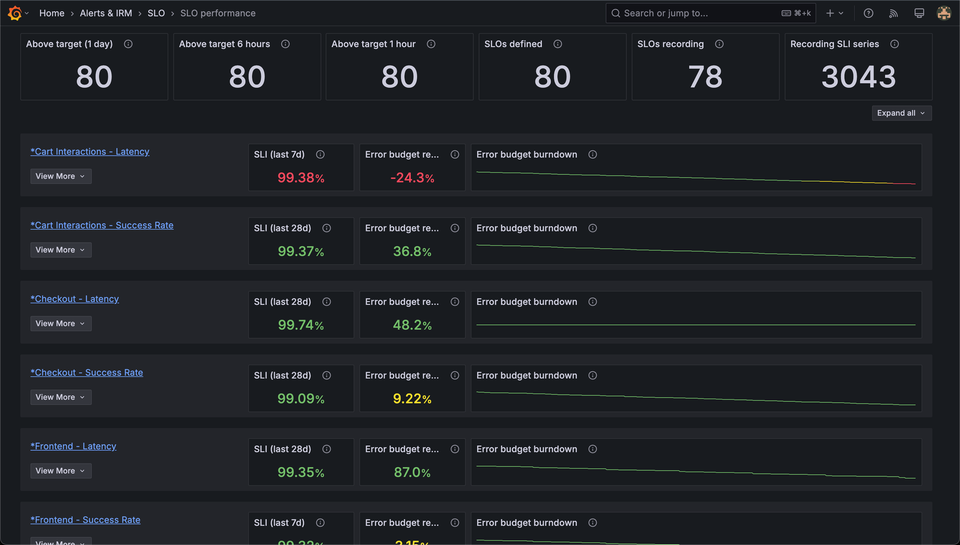
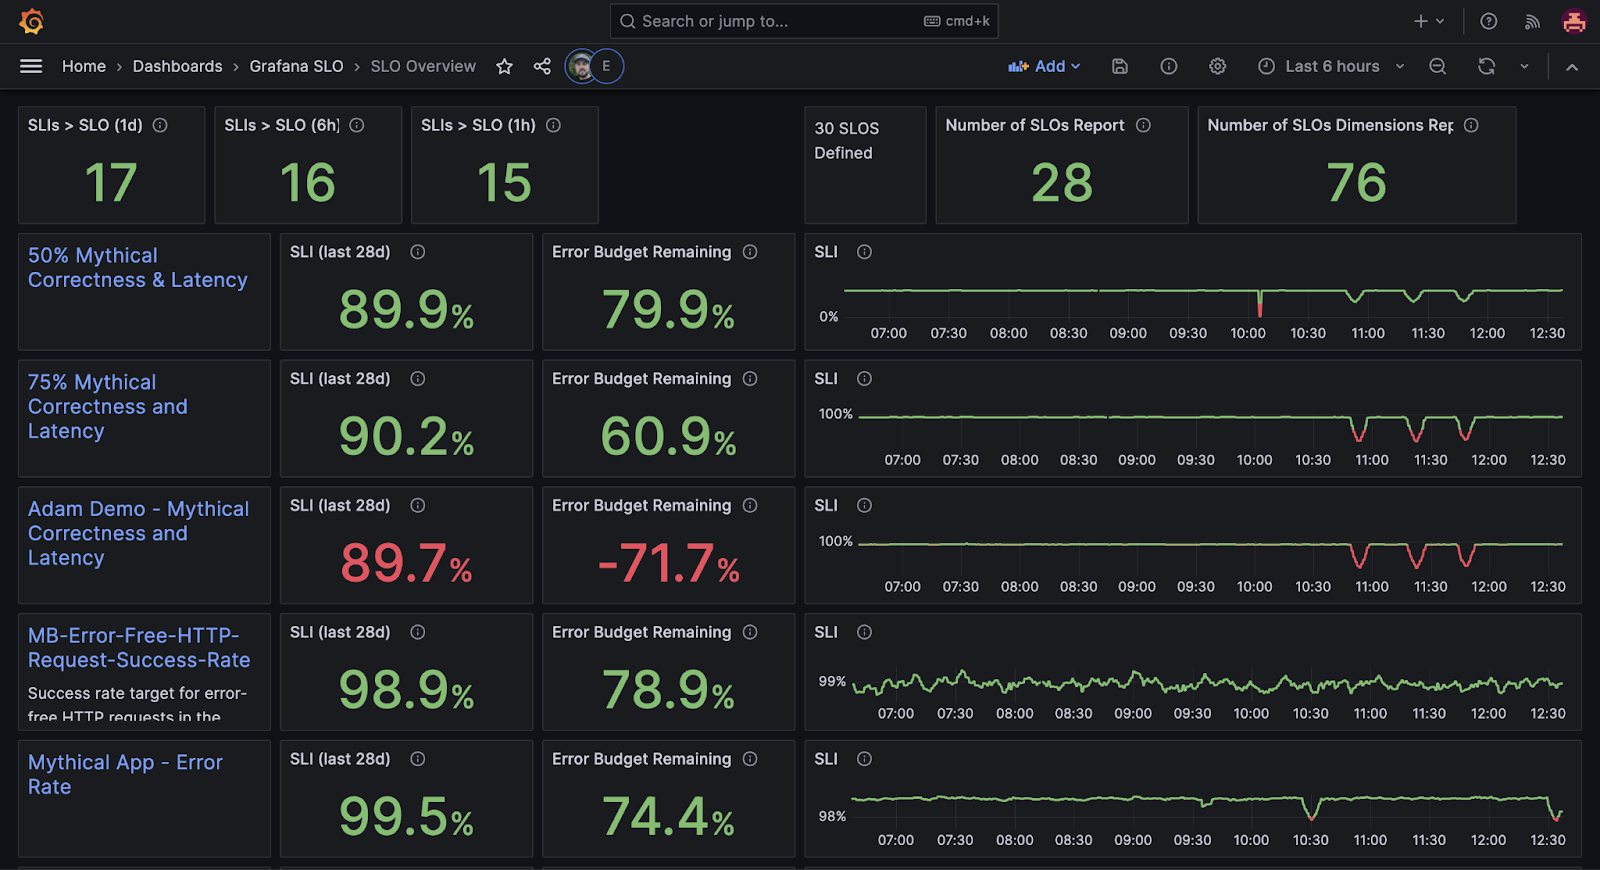
If better alerting is the main feature of SLOs, why don’t any of SLO products (including the ones from Grafana Labs) actually tell you how many times people got paged for that service? Why are we so focused on the “health” feature and error budgets here?
I don’t think this picture actually sells the main benefits of SLOs. I am not even sure developers & ICs are excited about this. This looks like it’s tailored towards management and leadership. But I still wonder how many times my leadership looks at a loooong list of SLOs and their performance and makes decisions based on those.
Well, as we see below, it turns out, they do, but it doesn't change the fact about reducing alert volumes.
Narrative needs to change
This whole narrative around error budgets and slowing down releases if the budget is burnt is actively hurting the adoption of SLOs. Teams would rather not commit to a number for their SLO because they are afraid of the consequences of burning the budget too early in the month.
I think we need to switch the narrative from error budgets and health to fewer and more actionable alerts as the main benefit. This makes it far more appealing and practical for users, particularly, ICs of each team to adopt SLOs. And honestly, it’s why I like SLOs, not this service health page.
We also have a clear indication of how many times an SLO alert fires, which is something I like.
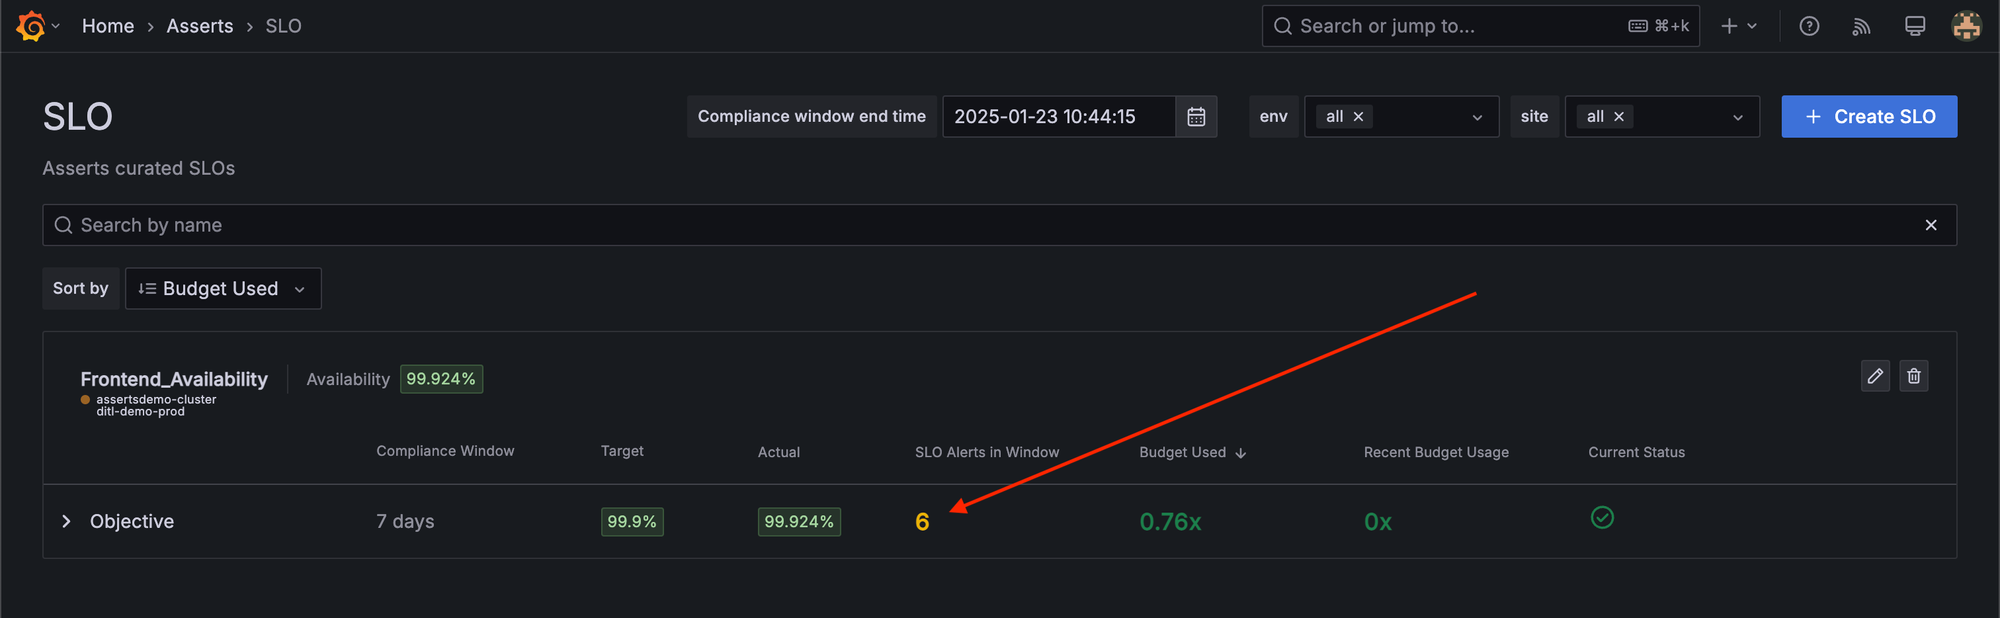
However, not every SLO alert results in a page. For example, if you have 10 clusters, and 5 of them are having issues at the same time, it's common to group them together and send one alert (which has details on which clusters are having issues).
What matters is the number of pages you get and not the number of alerts that fire. And our OnCall product doesn't yet provide insights broken down by Alert / SLO name.
Being practical when adopting SLOs
A big hurdle around adopting SLOs is picking the right SLI and targets. I have one piece of advice for you: JUST PICK SOMETHING.
When we rolled out SLOs internally, we made it super easy to opt-in and basically set the defaults to 99.9% of writes succeed in less than 1s and 99.9% of the reads succeed in less than 2.5s. You can tweak those numbers, but most people just started there and then as they got paged, they realized that they needed to tweak things and had a fair idea of what to pick.
People weren’t afraid to just pick something and start because there aren’t really any consequences for a service being in the RED in the dashboard. The benefits of SLOs were fewer, more actionable alerts and that's why we were adopting SLOs. Getting the thresholds wrong ensured that we fixed it within a week.
Error budgets are important
So I wrote the above post titled “SLOs are not about error budgets”, and shot it to several department heads at Grafana Labs, only to find push back. Dee even wrote an internal blog post titled “SLOs are about error budgets” (search the wiki for it if you're Grafanista).
Tech leads and department heads do care about error budgets, deeply. They own the SLAs for their service and want to make sure that the services do perform well. And we are at a scale that we do delay / slow releases if we're close to burning the budgets on our public services because it'll cost us real $$$ if we breach SLA. Even if there is no customer-facing SLA, it does give an indication towards the health of the service and help you make a call on the time spent on new features vs. improving stability.
However, your team might not have a customer-facing SLA that comes with associated $ cost. And you might not be inclined to slow / skip releases because of one incident at the beginning of the month. I still hope you will consider using SLOs to reduce alert noise.
Member discussion